Some of these tools gather metrics and graph them and do nothing else; others also send alerts.
Below we provide definitions of proprietary, SaaS, and open source to make the distinctions clear.
Some of those are key, like the capability of customizing the dashboard.
Neither is it so-called open source software, since the source code is not freely available.
What is freely available at Github are additional agents written by Nagios and its customers.
It is simply more than many companies would need.
Anyone can download the software.
Open source software is written and maintained by a team of developers in a code repository like Github.
It is free and open source.
Users can pay for support and training, which is how the company generates revenue.
Like many of the tools mentioned here, this one is available in several languages.
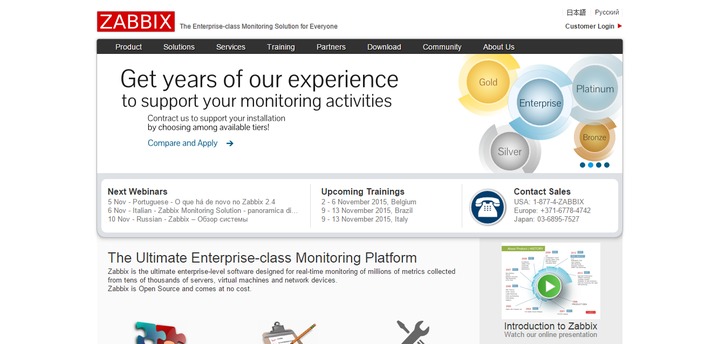
Zabbix has a lot of functionality, including data visualization with real-time graphing of performance.
Zabbix performs autodiscovery of web link devices and VMware VMs.
That means its not necessary to key those in manually.
It does this by simulating mouse clicks and user-interaction with the screen.
One useful feature of email alerts is the ability to program the escalation schedule.
That way, the email is sent up the chain of command until someone takes control of the issue.
Zappix has an API, making it possible to retrieve and update configuration and integrate with third-party apps.
Thus a script can be written to deploy it to new servers.
The product is written in C, so it should have a low memory footprint.
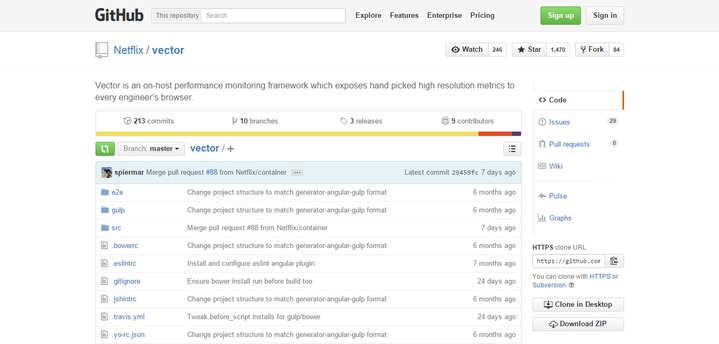
Netflix Vector
Netflix is the American video-streaming service and producer of films and TV.

They have expanded beyond the USA to many countries around the world.
Netflix is Amazon AWSs largest, and one of its earliest, customers.
Netflix gives away a lot of its software, including its performance-monitoring product called Vector.
The documentation is here.
Vector graphs performance metrics gathered from this open source tool are available here: Performance Co-Pilot (PCP).
The installation instructions are here.
Vector users configure which metrics they want to gather and whether they want a real-time or cumulative graph.
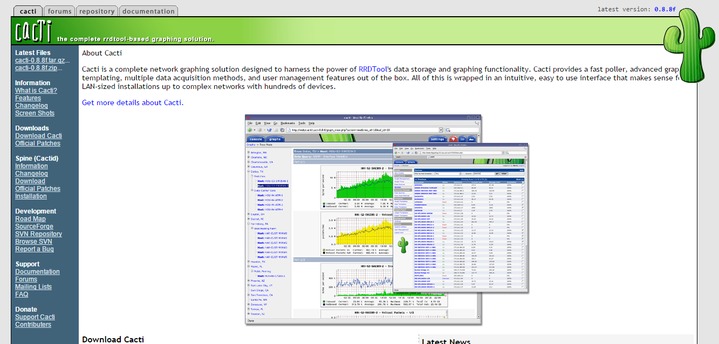
Cacti
Cacti is another graphic tool.
Since it has a wide variety of graphs, one requirement would be to learn some basics about graphing.
Cacti uses SNMP as its source and relies heavily on PHP.
Users would need to know something about PHP.
But since PHP is not much different from other scripting languages, learning it is not difficult.
Cost: free plan available, from $9.5 per month.
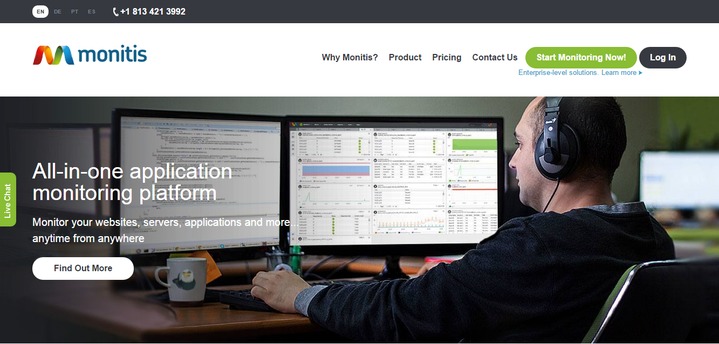
Monitis
Monitis is another cloud monitoring product.
Their product includes an API with a REST interface.
For instance, if it falls off to zero, something is wrong.
Cost: from $5 per month.
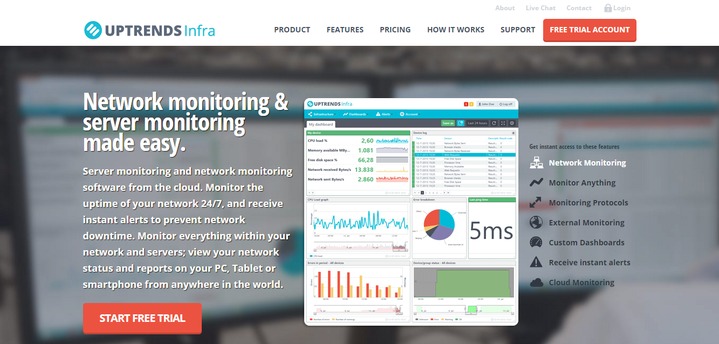
Uptrends Infra
Uptrends calls its monitoring software Infra.
Their cloud product monitors servers, data pipe devices, and data pipe protocols.
Cost: from $23 per month.
Proprietary software
Paessler
Paessler calls itself The data pipe monitoring company.
Their product supports SNMP, WMI, Packet Sniffing, Netflow, IPFIX, jFlow, and sFlow.
Cost: free plan available, from $1600.
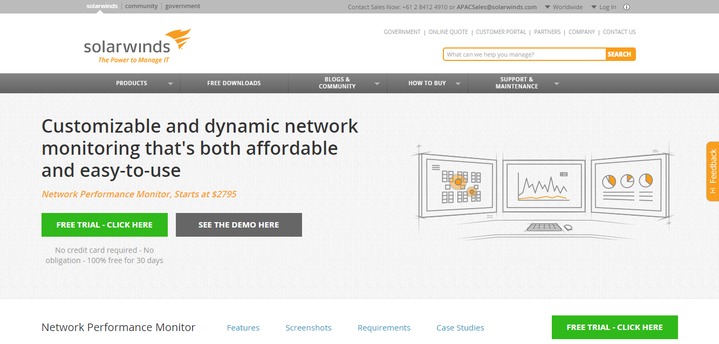
SolarWinds
Solar Windows also calls itself web link monitoring software.
Like Paessler, they ping servers and ports to see if the services are listening.
Cost: from $2795.
Cost: from $595.
